Introduction
The objective was to quantify the gap between "affordable" home energy bills and "actual" home energy bills. We were successful.
In 2003, Fisher, Sheehan & Colton (FSC) introduced a model that calculated the dollar amount by which "actual" home energy bills exceeded "affordable" home energy bills on a county-by-county basis for the entire country. This is the "home energy affordability gap." Updated every year since then, the model has become an invaluable tool for research, legislative analysis, program-planning and advocacy. The analyses are used by individuals and organizations across the country. The 2012 Home Energy Affordability Gap, published in May 2013, introduces the 2nd Series of FSC's annual Affordability Gap analysis. While remaining fundamentally the same, several improvements have been introduced in both data and methodology in the Affordability Gap (2nd Series). Explore our site to learn more.
For Example
Connecticut's 5th Congressional District

The aggregate 2012 Home Energy Affordability Gap for all households at or below 200% of the Federal Poverty Level in Connecticut's 5th Congressional District was $131,743,402. The gross 2012 LIHEAP allocation for the entire state was $79,532,000.
For Example
Marion County Oregon

The 2013 Home Energy Affordability Gap for each household at or below 50% of the Federal Poverty Level was $1,206. That was a home energy burden (bill as a percentage of income) of 22.9%. Housing analysts consider an energy burden of more than six percent (6%) to be unaffordable.
For Example
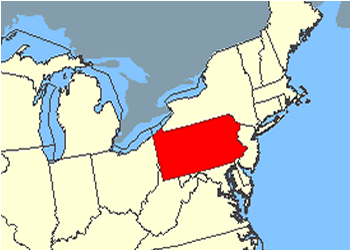
The Commonwealth of Pennsylvania

The aggregate 2012 Home Energy Affordability Gap for all households at or below 200% of the Federal Poverty Level in Pennsylvania was $1,840,924,328. The 2012 "Gap" for each household was $1,252 or $104/month.


